Alternative Text for Images, Graphs, Maps and Tables
Images, graphs, and tables are common in word documents. However, some students, due to neurodiversity, may struggle to connect images with their intended meaning. Other students may be diagnosed with a visual impairment that prevents them from clearly seeing this content. Applying alternative text, also known as descriptive text, to graphical elements in Word explicitly states the intended meaning, making the invisible visible again.

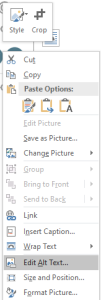
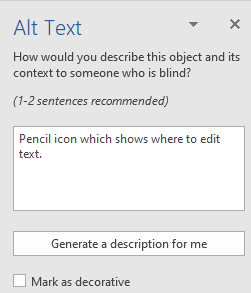
To add alternative text, right click on the images (or map, graphs, table), and click “Edit Alt-Text”. A new panel will appear on the right side. This panel allows you to add alternative text (alt text) to describe the image. To create effective alt text, try to imagine explaining the image to someone with their eyes closed. If the image serves a purely decorative purpose, you can select the ‘Mark as decorative image’ option.

Note: Using the “Generate description for me” button is not recommended.
Note: Avoid using phrases like “photo of…” as they are usually unnecessary. Screen readers will already announce the element is an image.
Note: If you need to be more in depth to describe the images, then use a caption or description in the surrounding text to add descriptive text.
Creating Meaningful Alt Text
- Be concise and descriptive. Write only what you expect a visual user would understand and gain from the image.
- Keep it brief. 120 characters or less is a good goal.
- If the image is explained in nearby text, you can be more concise.
- There is no need to repeat explanations made in the text.
- If the image contains words, it is generally important to include those words in the “Alt-Text”.
- For decorative images, label them as “decorative.”
Charts and Graphs
For graphs, it’s best practice to display the corresponding data table below the graph. This ensures that screen reader users can easily access the data associated with the graphs. If displaying a data table is not feasible, you can provide alternative text (alt text) for the chart or graph.
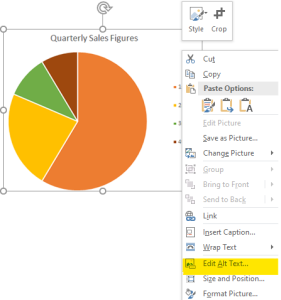
To add alt text to a chart or graph, follow the same procedure as you would for images. Ensure that the chart or graph itself is selected (not the contents within it). Right-click on the chart or graph, then choose ‘Edit Alt Text.’
When crafting alt text for charts and graphs, aim to distill the essential message. Consider what the graph is meant to convey and summarize that in the alt text.

Shapes, Icons, SmartArt, 3D Models, and Grouped Objects
If your content contains multiple shapes, flow charts, Word Art, or 3D models, it is crucial to include alt text to make this content accessible to screen readers. you can achieve this by grouping objects that convey the same meaning.
- After selecting all graphics that compose the full images, navigate to Drawing Tools > Format > Group
- You can now right-click the grouped image and select “Edit Alt Text” to add the alt text.
 How to Apply Alt-Text in Word
- Right click on the image (or map, graphs, table) in your document
- Select “Edit Alt-Text…” .
- On the right-hand side of the screen, enter concise and descriptive text the image communicates.
- If the image is only decorative, and does not contribute to the information the document is communicating, mark it as “Decorative”.
 Takeaways
- Adding Alt-text in the development phase of your content will make your page more accessible and result in less remediation work in the future.
- If the image is only for design purposes, you can mark the check box to indicate that the image is decorative.
 Tips
Tips
- Adding clear and concise alt-text is important for students who use assistive technologies.
- When composing descriptive text consider the image’s purpose, aim for descriptions under 120 characters if feasible.
- Including captions with images, charts and graphs or explanations alongside these graphics can help reduce the need for lengthy Alt-text.


