Reports
Table of Contents
- Top of the page
- Overview
- Sections
- Conflicts
- Instructors
- Times
- Rooms
- Bottlenecks
- Enrollment
- Export
- Integration
Top of the Page
At the top of each of the report pages, the menu is the same.

From left to right:
- Term – You can change what term’s information you are viewing by picking a new term from the drop-down box.
- Department – You can change what department you are viewing by picking a different department from the drop-down box.
- Saved Views – If you add a filter to your view, you can save the filter view by clicking SAVED VIEWS.
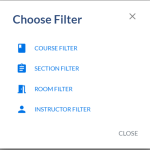
- Filter – You can add several different filters to your view. You would need to know the specific field and filter type to use this feature. Please reach out to Academic Affairs if you’d like more information.
Overview
Courses (Term)
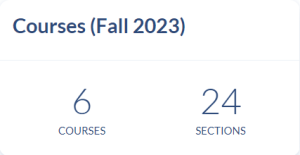
The “Courses” card reflects the total number of available courses and sections for the selected term.
Instructors/Preferences
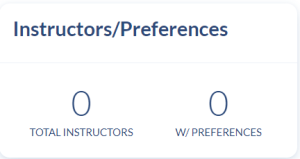
This card indicates the total number of instructors for the selected term, as well as the number of instructors who have indicated preferences in their profile.
Schedule Daily Distribution
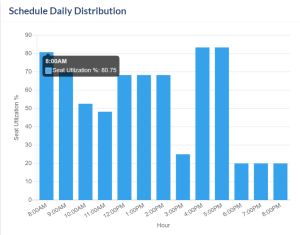
This chart shows your seat utilization percentage for any given hour. Seat utilization indicates the ratio of enrolled students to seats in academic rooms at any given time.
Current Trends
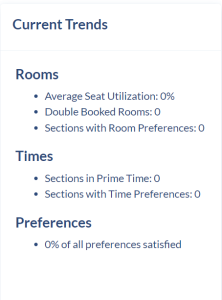
This summarizes key trends for rooms, times, and preferences. Use this for an at-a-glance snapshot of areas you might want to investigate further for future schedule planning.
Sections
Courses/Sections
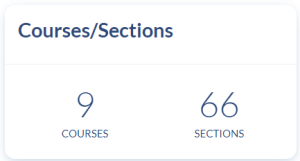
The total number of available courses and sections for the selected term.
Section Times
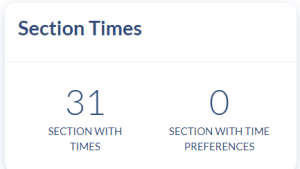
Indicates the number of sections that have been assigned a time as well as the number of sections that have designated a preferred time.
Section Rooms
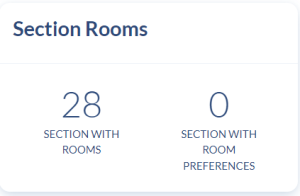
Indicates the number of sections that have been assigned a room (including online rooms) as well as the number of sections that have designated a preferred room.
Section Type
We don’t currently use this feature in Coursedog. Indicates the number of sections for any given section type (e.g. Lecture, lab, internship, etc.).
Preference Satisfaction
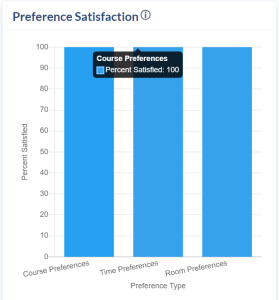
The preference satisfaction graph shows you what percentage of your courses satisfy the various preferences that can be imposed upon them, including room preferences outlined on the Section Template as well as preferences submitted by faculty.
Max Enrollment Range
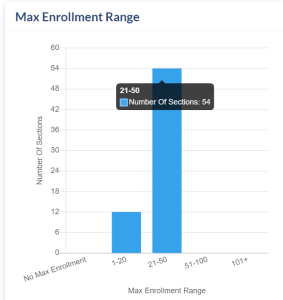
Shows the number of sections that have designated a maximum enrollment, what the range is for that max.
Sections Per Course
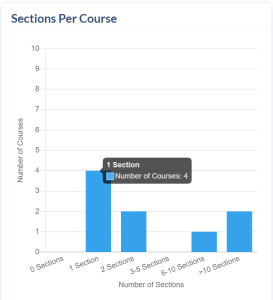
This chart gives you an idea of how many courses don’t have any sections; how many courses have 1 section; and so on.
Preferences
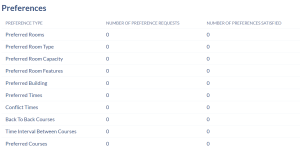
The list of preferences at the bottom of the page shows all possible preferences, the number of sections that those preferences are imposed upon, and the number that satisfy them.
Conflicts
Conflicts Card
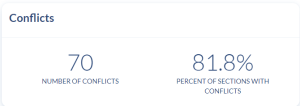
Shows the total number of sections with conflicts, as well as what percentage of sections that total represents.
Preferences Card

Captures the total number of preferences that have been specified, along with the number preferences that have been satisfied.
Conflicts List
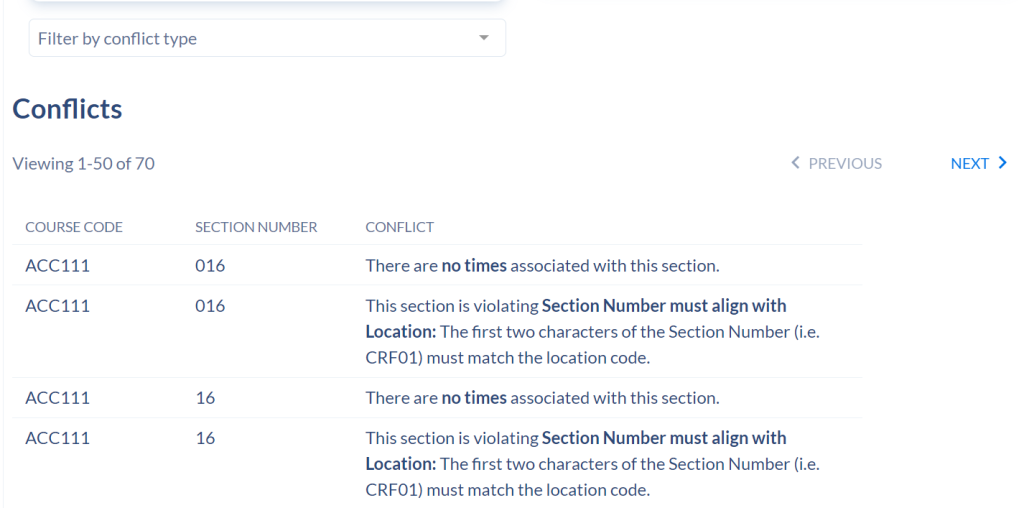
-
You can filter the list by Conflict Type.
-
You can use the multi-select dropdown in the middle of the page to filter by conflict type.
-
By selecting one conflict type, your dashboard will only show the sections that currently have that specific conflict. Select more than one to show all sections that currently have at least one of the selected conflict types.
-

If no conflict types are selected from the dropdown, the list will include ALL conflicts, the table captures the course code and section number where the conflict is occurring as well as the conflict type. You can resolve any listed conflict from this page – just click into a conflict to open the Section Editor.
Instructors
Instructors
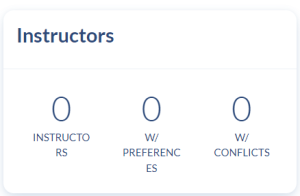
Captures the total number of instructors at your institution for the selected term (and department, if you have selected a department from the dropdown).
- w/ Preferences – The number of instructors who have preferences associated with their faculty profiles. These faculty have completed preference forms, or have had their preferences added to their profile directly.
- w/ Conflicts – This is generally checking against double-bookings as well as an instructor’s listed preferences.
Assignments
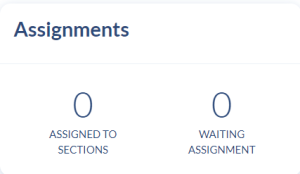
- Assigned the Sections – The number of instructors who have been assigned to at least one section.
- Waiting Assignment – This number shows you at-a-glance the number of instructors in your system who aren’t assigned to teach a class that term.
Instructor Type
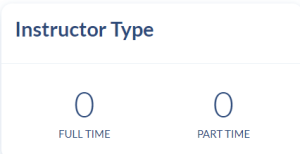
- Full Time – The number of instructors that are designated as full-time instructors.
- Part Time – The number of instructors that are designated as part-time instructors.
Average Credits
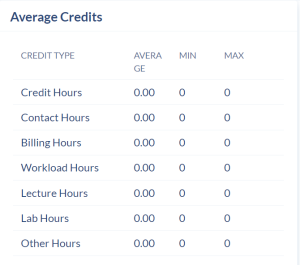
The average number of credits assigned across instructors.
Preference Satisfaction
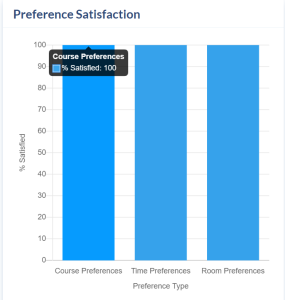
This graph shows what percentage of faculty preferences have been satisfied.
Instructor Hourly Availability
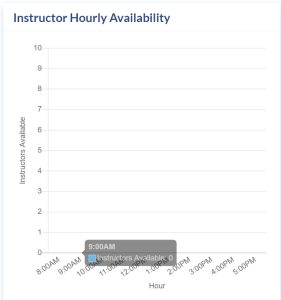
This graph captures the total number of instructors available at any given hour. Availability is calculated as follows: It takes ALL Instructors, searches for their preferences, and then subtracts the given Instructor from the sum for the given hour if they either:
- Do not have the given hour among their preferred times OR
- Have the given hour among their conflicts.
Instructor Daily Availability
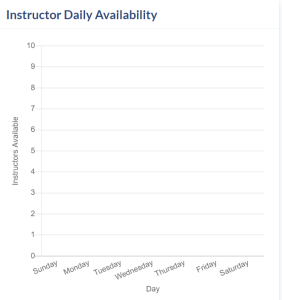
This graph captures the total number of instructors available on any given day.
Instructors with Back-to-Back Sections

Indicates which instructors are currently scheduled to teach back-to-back sections, so you can determine if adjustments need to be made.
Times
Meeting Patterns (Card)
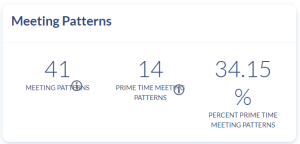
- Meeting Patterns – This number reflects the total number of standard meeting patterns available for schedulers.
- Prime Time Meeting Patterns – Prime time meeting patterns are meeting patterns scheduled during prime times; i.e., the most popular days/times for scheduling academic sections, where room utilization is often disproportionately high.
- Percent Prime Time Meeting Patterns – The percentage of available meeting patterns that occur during the most popular days/times.
Assignments
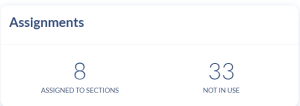
- Assigned to Sections – The number of meeting patterns that are actually assigned to any sections. No meeting pattern is counted more than once. I.e. If Meeting Pattern A is used for 5 sections, that will count as “1” in this tally.
- Not in Use – The number of meeting patterns not currently assigned to any sections.
Schedule Hourly Distribution
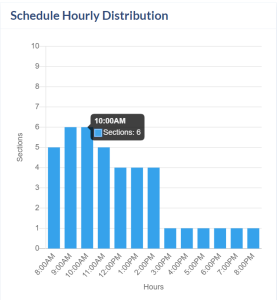
This graph helps you visualize the most popular meeting patterns. A 6pm-7:30pm section will count in both the 6:00pm and 7:00pm columns.
Seat Utilization by Hour
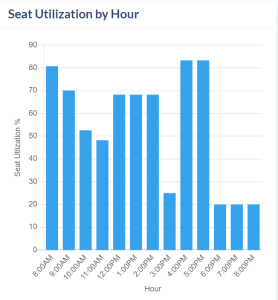
This indicates the ratio of actual enrollment to maximum enrollment. This gives us an enrollment ratio representing available seats in academic rooms that are “filled” by a student at any given hour.
Time Preference Satisfaction
This graph shows the percentage of time preferences that have been satisfied, including preferred times, conflict times, back-to-back courses, and time interval between courses.
Schedule Daily Distribution
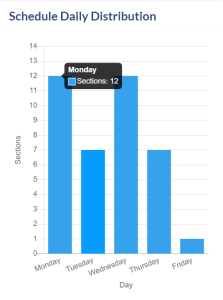
Helps you visualize which days are the busiest.
Most Popular Meeting Patterns
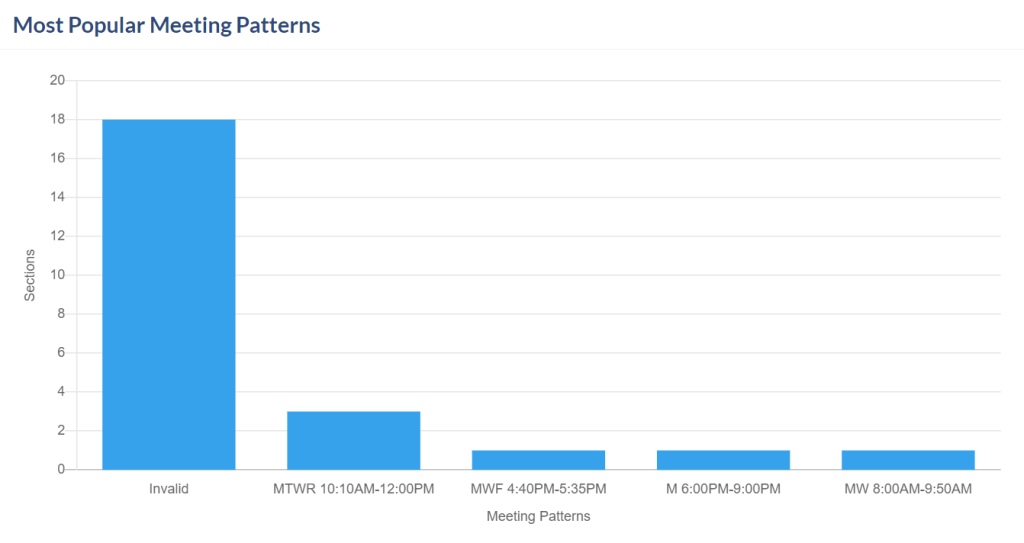
Shows which meeting patterns are most commonly assigned to sections.
Meeting Patterns (List)
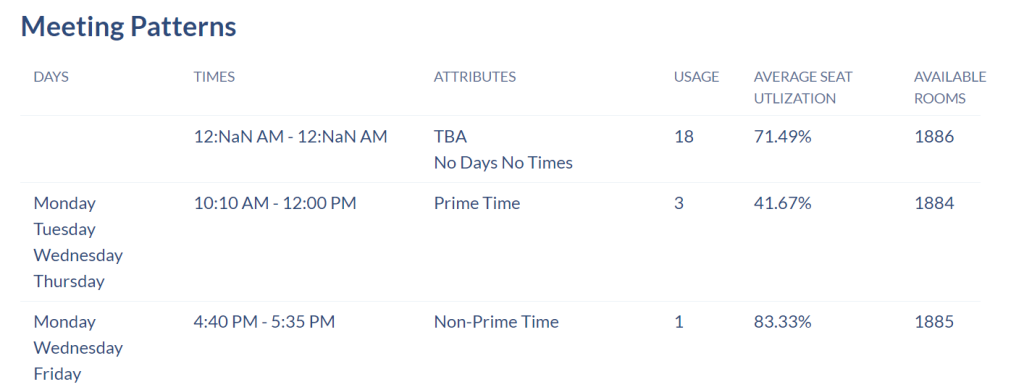
For each established meeting pattern, the meeting patterns list gives an overview of the days, times, and attributes (prime time or non-prime time) of the meeting pattern. It also provides statistical insights about each meeting pattern:
-
Usage – Total number of sections assigned to that meeting pattern.
- Average Seat Utilization – Ratio of seats in use to total available seats during that meeting pattern.
- Available Rooms – Total number of active rooms not currently assigned to a section during that meeting pattern.
Rooms
Room Assignments
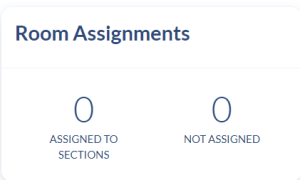
- Assigned to Sections – The number of rooms that have been assigned to at least one section. No room will be counted more than once; i.e. If a room is assigned to more than one section, that will still be considered a “1” for this tally.
- Not Assigned – The number of available rooms that haven’t been assigned to a section.
Conflicts
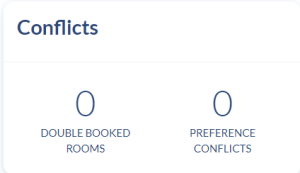
- Double Booked Rooms – Rooms that have been assigned to more than one section at the same time.
- Preference Conflicts – The number of rooms whose assignment doesn’t align with a preference for the section and/or assigned instructor.
Usage
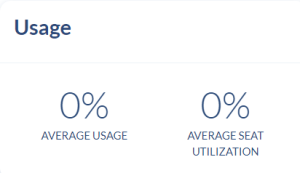
- Average Usage – For each room that is Active and not Online, the room usage is calculated through the following method:
- For each day the institution is open, it calculates how many minutes the institution is open for that day. For example, 9AM to 10PM (M-F) and 9AM – 4PM (Saturday), which is equivalent to 780 and 420 minutes, respectively. By default, Coursedog sets an institution’s open hours to Monday-Friday from 8AM to 10PM.
- Then it checks how many minutes that room has a section assigned to it for each day. For example, if a section is assigned from 9AM to 10AM, that is equivalent to 60 minutes.
- After looping through all the days, it arrives with two numbers: total minutes available and minutes where the room is used.
- It gets the room usage percentage by dividing the minutes used by the total minutes available.
- For the average usage of all rooms, it adds up the usage of each room, and then divide by the total number of rooms (excluding all online and Inactive rooms).
- Average Seat Utilization – Ratio of seats in use to total available seats.
Seat Utilization by Hour
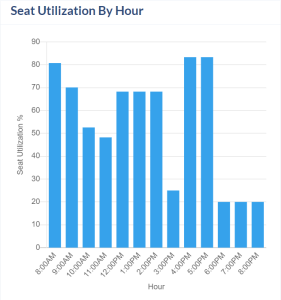
Ratio of seats in use to total available seats by hour.
Seat Utilization by Day
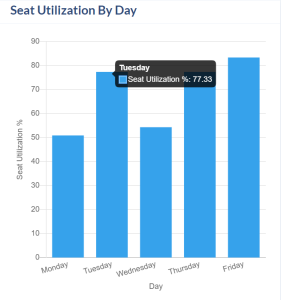
Ratio of seats in use to total available seats by day.
Seat Utilization by Room Size
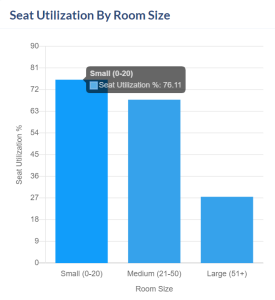
Ratio of seats in use to total available seats by room size.
Most Used Buildings
This graph shows you which buildings have the most sections meeting in their rooms.
Average Usage by Building
Using the formula for room usage described above, we also show the average room usage for all the rooms separated by the building they are in.
Average Usage by Room Type
We aren’t currently using room types other than classroom and other.
Room Preference Satisfaction
We aren’t currently using the room preferences feature.
Rooms (List)

This is a complete list of all available rooms along with key descriptions: Room Name, Room Type, Capacity, Number of Sections, Average Seat Utilization, and Average Usage.
Bottlenecks
The bottlenecks report shows all of your sections with bottlenecks that would cause the optimizer to leave some sections unassigned. If you plan on using the Section Optimizer, resolving bottlenecks first will increase the odds that your optimization will work on the first try.
Room Bottleneck Summary

- Number of Bottle Necks – The total number of bottlenecks.
- Number of Sections – The total number of sections with bottlenecks.
Room Bottlenecks

This is a complete list of all bottlenecks, including Course Code, Section Number, and a description of the bottleneck. An example bottleneck might read: “This section is meeting at a time when 18 sections (including this one) require a room of capacity 74 or greater. However, there are only 13 rooms with the required capacity available at this time.”
Enrollment
Overview (Card)

- Total Enrollment – The total number of filled seats across sections
- Percent of Balanced Sections – The percent of sections whose enrollment ratio is between 70-95%.
Underfilled

Sections whose enrollment ratio is under 70%.
Overfilled

Sections whose enrollment ratio are at or above 95%.
Zero Enrollment
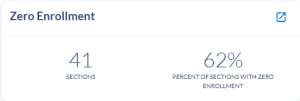
Indicates the number of sections that don’t have any students enrolled.
Zero Max Enrollment
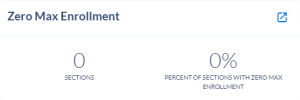
Indicates the number of sections that haven’t designated a maximum enrollment. This should always be at zero since section capacity is required.
Above Room Capacity
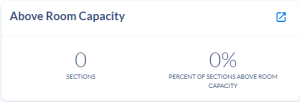
Indicates how many sections have more students enrolled than the room size allows.
Enrollment by Day
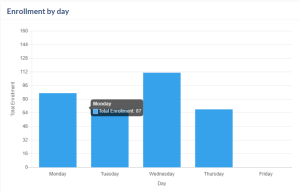
Shows the total number of students enrolled in classes for any given day.
Enrollment by Hour
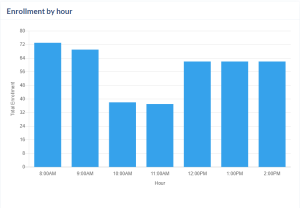
Shows the total number of students enrolled in classes for any given hour.
Export
Coursedog has many canned reports available to its users that you can download as a CSV file. This page does include a description for each of their reports. Please reach out to Academic Affairs if you’d like more information about any of the reports.
Integration
The card at the top of the screen summarizes the number of errors and the percent of sections that have integration errors. The Academic Affairs office receives emails when there are integration errors during the nightly reports and will address any that come up.

