
2.4 Project Start Up
The project initiation phase is the first phase within the project management life cycle, as it involves starting up a new project. Within the initiation phase, the business problem or opportunity is identified, a solution is defined, a project is formed, and a project team is appointed to build and deliver the solution to the customer. A business case/proposal (sometimes called feasibility study) is created to define the problem or opportunity in detail and identify a preferred solution for implementation. The business case/proposal includes:
- A detailed description of the problem or opportunity with headings such as Introduction, Business Objectives, Problem/Opportunity Statement, Assumptions, and Constraints
- A list of the alternative solutions available
- An analysis of the business benefits, costs, risks, and issues
- A description of the preferred solution
- Main project requirements
- A summarized plan for implementation that includes a schedule and financial analysis
SMART Project Objectives
In the early 1980s, George T. Doran introduced the SMART set of criteria for projects, goals and objectives. S+MART is an acronym for Specific, Measurable, Assignable, Realistic, and Time-Related. The smart criteria have been applied in many different areas of management, including project management. Let’s take a look at each of Doran’s criteria as they apply to project management.
Specific – A project needs to be specific about what it will accomplish. Unlike many organizational goals, the goal of a project should not be vague or nebulous. An organization may want to “make London, Ontario a great place to live,” but its projects need to focus on a specific goal. For example, a more specific goal would be to build a downtown farmers’ market. A project that is specific is one that can be clearly communicated to all team members and stakeholders. A specific project goal will answer the five ‘W’ questions:
- What do we want to accomplish?
- Why are we undertaking this project?
- Who is involved or will be affected by the project?
- Where will this project be conducted?
- Which constraints (scope, time, money, risk, etc.) have been placed on our project?
Measurable – How will project progress and success be measured? What will be the measurable difference once our project is completed successfully? These measures should be quantifiable.
Assignable – Who will do the work? Can people be identified who have the expertise in the organization to complete this work? Or can the expertise be hired from outside of the organization?
Realistic – Is it realistic that the organization can achieve this project, given its talents and resources? This is a very important consideration for businesses of all sizes. Yes, it would be great to produce a new driverless car, but is that realistic given the resources that the organization has available?
Time-related – when will the project be completed and how long will it take? These criteria can be very useful when defining a project. If the description for a project does not meet all these criteria, then it is time to go back to the drawing board and make sure that what is being described is really a project, rather than a program or strategic goal.
Comparing Options Using a Weighted Decision Matrix
Sometimes we have multiple options to choose from when determining requirements and deciding which project to work on. To select the best option, we can use tools such as a weighted decision matrix.
A basic decision matrix consists of establishing a set of criteria for options that are scored and summed to gain a total score that can then be ranked. Importantly, it is not weighted to allow a quick selection process.
A weighted decision matrix operates in the same way as the basic decision matrix but introduces the concept of weighting the criteria in order of importance. The resultant scores better reflect the importance to the decision maker of the criteria involved. The more important a criterion, the higher the weighting it should be given. Each of the potential options is scored and then multiplied by the weighting given to each of the criteria to produce a result.
The advantage of the weighted decision matrix is that subjective opinions about one alternative versus another can be made more objective. Another advantage of this method is that sensitivity studies can be performed. An example of this might be to see how much your opinion would have to change in order for a lower-ranked alternative to outrank a competing alternative.
A weighted decision matrix therefore allows decision makers to structure and solve their problem by:
- Specifying and prioritizing their needs with a list a criteria; then
- Evaluating, rating, and comparing the different solutions; and
- Selecting the best matching solution.
A weighted decision matrix is a decision tool used by decision makers.
A decision matrix is basically an array presenting on one axis a list of alternatives, also called options or solutions, that are evaluated regarding, on the other axis, a list of criteria, which are weighted depending on their respective importance in the final decision to be taken.
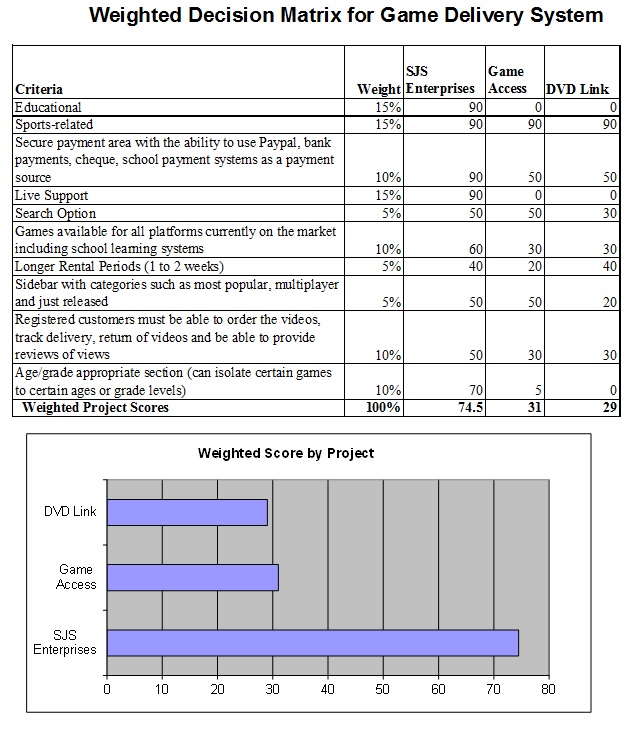
Weighted Decision Matrix Sample
The example in Figure 7.4 shows a weighted decision matrix that compared three options for a web development project (SJS Enterprises). This method is especially useful when choosing purchase alternatives and comparing them against specific desirable system requirements.
Financial Considerations
In many new project endeavors, we need to find out if our project is financially feasible. We do that by using net present value (NPV), rate of return (ROI), and payback analysis.
Net Present Values (NPV)
A dollar earned today is worth more than a dollar earned one or more years from now. The NPV of a time series of cash flows, both incoming and outgoing, is defined as the sum of the present values (PVs) of the individual cash flows of the same entity.
In the case when all future cash flows are incoming and the only outflow of cash is the purchase price, the NPV is simply the PV of future cash flows minus the purchase price (which is its own PV). NPV is a standard method for using the time value of money to appraise long-term projects. Used for capital budgeting and widely used throughout economics, finance, and accounting, it measures the excess or shortfall of cash flows, in present value terms, once financing charges are met.
NPV can be described as the “difference amount” between the sums of discounted cash inflows and cash outflows. It compares the present value of money today to the present value of money in the future, taking inflation and returns into account.
The NPV of a sequence of cash flows takes as input the cash flows and a discount rate or discount curve and outputs a price.
Each cash inflow/outflow is discounted back to its present value (PV). Then they are summed. Therefore NPV is the sum of all terms.
 where
where
- t is the time of the cash flow
- i is the discount rate (the rate of return that could be earned on an investment in the financial markets with similar risk; the opportunity cost of capital)
- Rt is the net cash flow (i.e., cash inflow − cash outflow, at time t).
NPV is an indicator of how much value an investment or project adds to the firm. With a particular project, if NPV is a positive value, the project is in the status of positive cash inflow in the time t. If NPV is a negative value, the project is in the status of discounted cash outflow in the time t. Sometimes risky projects with a positive NPV could be accepted. This does not necessarily mean that they should be undertaken since NPV at the cost of capital may not account for opportunity cost (i.e., comparison with other available investments). In financial theory, if there is a choice between two mutually exclusive alternatives, the one yielding the higher NPV should be selected.
| If… | It means… | Then… |
|---|---|---|
| NPV > 0 | The investment would add value to the firm. | The project may be accepted. |
| NPV < 0 | The investment would subtract value from the firm. | The project should be rejected. |
| NPV = 0 | The investment would neither gain nor lose value for the firm. | We should be indifferent in the decision whether to accept or reject the project. This project adds no monetary value. Decision should be based on other criteria (e.g., strategic positioning or other factors not explicitly included in the calculation). |
| Periods (years) | 6% | 8% | 10% | 12% | 14% |
|---|---|---|---|---|---|
| 1 | 0.943 | 0.926 | 0.909 | 0.893 | 0.877 |
| 2 | 0.890 | 0.857 | 0.826 | 0.797 | 0.769 |
| 3 | 0.840 | 0.794 | 0.751 | 0.712 | 0.675 |
| 4 | 0.792 | 0.735 | 0.683 | 0.636 | 0.592 |
| 5 | 0.747 | 0.681 | 0.621 | 0.567 | 0.519 |
| 6 | 0.705 | 0.630 | 0.564 | 0.507 | 0.456 |
| 7 | 0.665 | 0.583 | 0.513 | 0.452 | 0.400 |
| 8 | 0.627 | 0.540 | 0.467 | 0.404 | 0.351 |
| 9 | 0.592 | 0.500 | 0.424 | 0.361 | 0.308 |
| 10 | 0.558 | 0.463 | 0.386 | 0.322 | 0.270 |
NPV Example
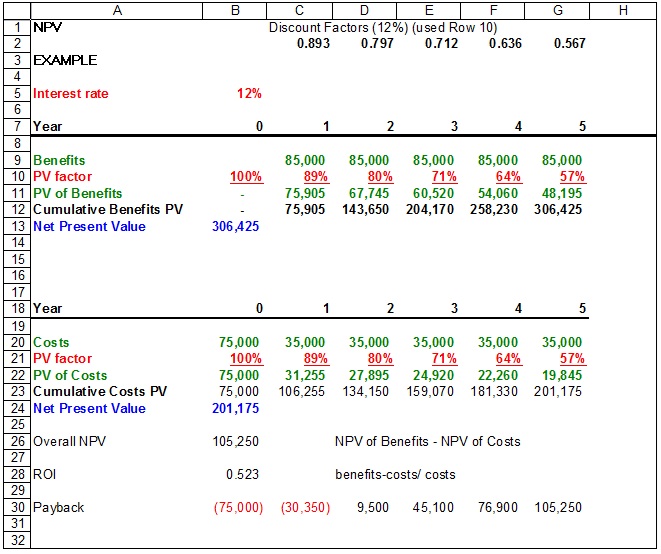
The following example is calculating the NPV of a project at a discount rate of 12%. The project takes five years to complete with given benefits and costs for each year. In Year 0, there is no benefit to the organization, just an initial cost of $75,000 with no discount rate. In Year 1, the discount rate is 89%. This means that at 12% assumed interest, the time value of money says that the $1 today is worth $0.89 in one year, $0.80 in two years, etc. By calculating the NPV for the benefits and the costs, you subtract the NPV of all costs from the NPV of all benefits. The final result is a positive value of $105,175.
Return On Investment (ROI)
Return on investment (ROI) is a performance measure used to evaluate the efficiency of an investment or to compare the efficiency of a number of different investments. It is one way of considering profits in relation to capital invested.
This is calculated by subtracting the project’s costs from the benefits and then dividing by the costs. For example, if you invest $100 and your investment is worth $110 next year, the ROI is (110 − 100) ÷ 100 = 0.1 or a 10% return.
In our example: (306,425 − 201,175) ÷ 201,175 = 0.52, or a 52% return. That’s considered a nice return on investment.
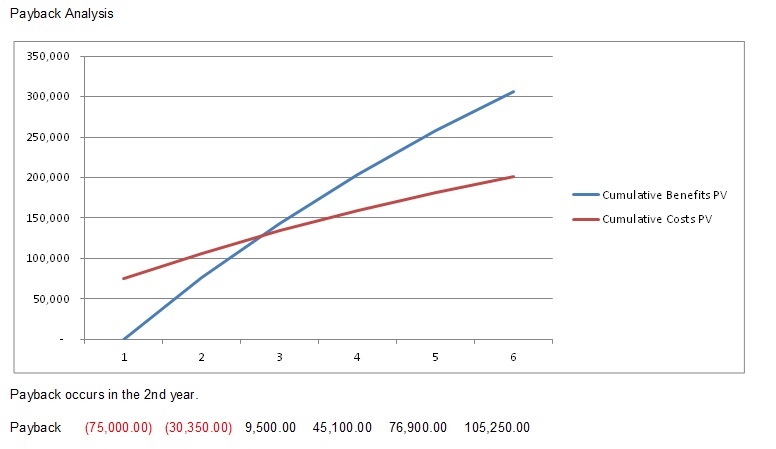
Payback Analysis
Payback analysis is important in determining the amount of time it will take for a project to recoup its investments. This is the point at which the benefits start to outweigh the costs. The best way to see that is by charting the cumulative benefits and costs. As you can see in the example in Figure 7.5, the cumulative benefits outweigh the cumulative costs in the second year.
Text Attributions
This chapter of is a derivative the following texts:
Essentials of Project Management by Adam Farag is licensed under a Creative Commons Attribution-NonCommercial-ShareAlike 4.0 International License, except where otherwise noted.
