
21 Project Initiation
For example, an objective of the team principle (project manager) of a Formula 1 racing team may be that their star driver, “finish the lap as fast as possible.” That objective is filled with ambiguity.
How fast is “fast as possible?” Does that mean the fastest lap time (the time to complete one lap) or does it mean the fastest speed as the car crosses the start/finish line (that is at the finish of the lap)?
By when should the driver be able to achieve the objective? It is no use having the fastest lap after the race has finished, and equally the fastest lap does not count for qualifying and therefore starting position, if it is performed during a practice session.
The ambiguity of this objective can be seen from the following example. Ferrari’s Michael Schumacher achieved the race lap record at the Circuit de Monaco of 1 min 14.439 sec in 2004 (Figure 7.2). However, he achieved this on lap 23 of the race, but crashed on lap 44 of a 77-lap race. So while he achieved a fastest lap and therefore met the specific project goal of “finish the lap as fast as possible,” it did not result in winning the race, clearly a different project goal. In contrast, the fastest qualifying time at the same event was by Renault’s Jarno Trulli (1 min 13.985 sec), which gained him pole position for the race, which he went on to win (Figure 7.2). In his case, he achieved the specific project goal of “finish the lap as fast as possible,” but also the larger goal of winning the race.
The objective can be strengthened considerably if it is stated as follows: “To be able to finish the 3.340 km lap at the Circuit de Monaco at the Monaco Grand Prix in 1 min 14.902 sec or less, during qualifying on May 23, 2009.” This was the project objective achieved by Brawn GP’s Jenson Button (Figure 7.2).

Despite achieving the project goal of the “finish the lap as fast as possible,” Ferrari’s Michael Schumacher crashed 21 laps later and did not finish the race (top); Renault’s Jarno Trulli celebrating his win at the 2004 Monaco Grand Prix (middle); Jenson Button took his Brawn GP car to pole position at the Monaco Grand Prix with a lap time of 1 min 14.902 sec. He also went on to win the race, even though he did not achieve that lap time during the race (bottom).
There is still some ambiguity in this objective; for example, it assumes the star driver will be driving the team’s race car and not a rental car from Hertz. However, it clarifies the team principal’s intent quite nicely. It should be noted that a clear goal is not enough. It must also be achievable. The team principal’s goal becomes unachievable, for example, if he changes it to require his star driver to finish the 3.340 km lap in 30 sec or less.
To ensure the project’s objectives are achievable and realistic, they must be determined jointly by managers and those who perform the work. Realism is introduced because the people who will do the work have a good sense of what it takes to accomplish a particular task. In addition, this process assures some level of commitment on all sides: management expresses its commitment to support the work effort and workers demonstrate their willingness to do the work.
Imagine an office manager has contracted a painter to paint his office. His goal or objective is to have the office painted a pleasing blue colour. Consider the conversation that occurs in Figure 7.3 after the job was finished.
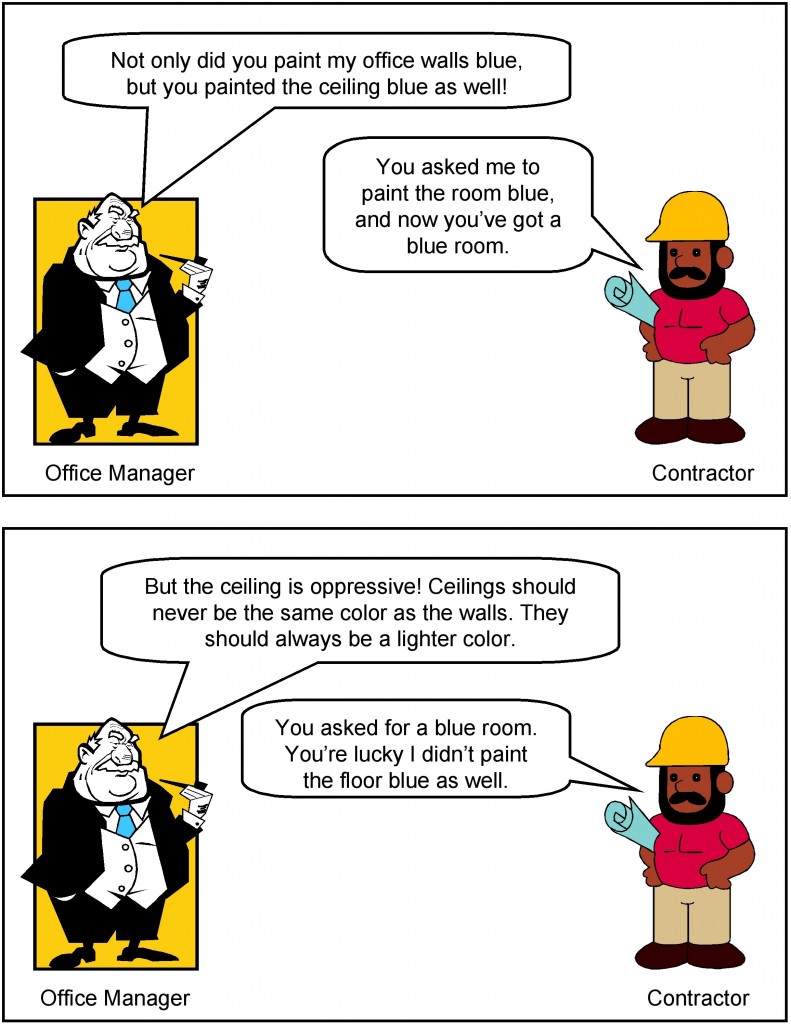
This conversation captures in a nutshell the essence of a major source of misunderstandings on projects: the importance of setting clear objectives. The office manager’s description of how he wanted the room painted meant one thing to him and another to the painter. As a consequence, the room was not painted to the office manager’s satisfaction. Had his objective been more clearly defined, he probably would have had what he wanted.
Comparing Options Using a Weighted Decision Matrix
Sometimes we have multiple options to choose from when determining requirements and deciding which project to work on. To select the best option, we can use tools such as a weighted decision matrix.
A basic decision matrix consists of establishing a set of criteria for options that are scored and summed to gain a total score that can then be ranked. Importantly, it is not weighted to allow a quick selection process.
A weighted decision matrix operates in the same way as the basic decision matrix but introduces the concept of weighting the criteria in order of importance. The resultant scores better reflect the importance to the decision maker of the criteria involved. The more important a criterion, the higher the weighting it should be given. Each of the potential options is scored and then multiplied by the weighting given to each of the criteria to produce a result.
The advantage of the weighted decision matrix is that subjective opinions about one alternative versus another can be made more objective. Another advantage of this method is that sensitivity studies can be performed. An example of this might be to see how much your opinion would have to change in order for a lower-ranked alternative to outrank a competing alternative.
A weighted decision matrix therefore allows decision makers to structure and solve their problem by:
- Specifying and prioritizing their needs with a list a criteria; then
- Evaluating, rating, and comparing the different solutions; and
- Selecting the best matching solution.
A weighted decision matrix is a decision tool used by decision makers.
A decision matrix is basically an array presenting on one axis a list of alternatives, also called options or solutions, that are evaluated regarding, on the other axis, a list of criteria, which are weighted depending on their respective importance in the final decision to be taken.
Weighted Decision Matrix Sample
The example in Figure 7.4 shows a weighted decision matrix that compared three options for a web development project (SJS Enterprises). This method is especially useful when choosing purchase alternatives and comparing them against specific desirable system requirements.

Financial Considerations
In many new project endeavors, we need to find out if our project is financially feasible. We do that by using net present value (NPV), rate of return (ROI), and payback analysis.
Net Present Values (NPV)
A dollar earned today is worth more than a dollar earned one or more years from now. The NPV of a time series of cash flows, both incoming and outgoing, is defined as the sum of the present values (PVs) of the individual cash flows of the same entity.
In the case when all future cash flows are incoming and the only outflow of cash is the purchase price, the NPV is simply the PV of future cash flows minus the purchase price (which is its own PV). NPV is a standard method for using the time value of money to appraise long-term projects. Used for capital budgeting and widely used throughout economics, finance, and accounting, it measures the excess or shortfall of cash flows, in present value terms, once financing charges are met.
NPV can be described as the “difference amount” between the sums of discounted cash inflows and cash outflows. It compares the present value of money today to the present value of money in the future, taking inflation and returns into account.
The NPV of a sequence of cash flows takes as input the cash flows and a discount rate or discount curve and outputs a price.
Each cash inflow/outflow is discounted back to its present value (PV). Then they are summed. Therefore NPV is the sum of all terms.
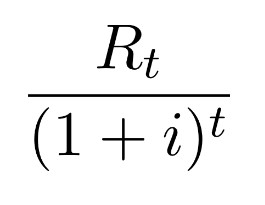 where
where
- t is the time of the cash flow
- i is the discount rate (the rate of return that could be earned on an investment in the financial markets with similar risk; the opportunity cost of capital)
- Rt is the net cash flow (i.e., cash inflow − cash outflow, at time t).
NPV is an indicator of how much value an investment or project adds to the firm. With a particular project, if NPV is a positive value, the project is in the status of positive cash inflow in the time t. If NPV is a negative value, the project is in the status of discounted cash outflow in the time t. Sometimes risky projects with a positive NPV could be accepted. This does not necessarily mean that they should be undertaken since NPV at the cost of capital may not account for opportunity cost (i.e., comparison with other available investments). In financial theory, if there is a choice between two mutually exclusive alternatives, the one yielding the higher NPV should be selected.
| If… | It means… | Then… |
|---|---|---|
| NPV > 0 | The investment would add value to the firm. | The project may be accepted. |
| NPV < 0 | The investment would subtract value from the firm. | The project should be rejected. |
| NPV = 0 | The investment would neither gain nor lose value for the firm. | We should be indifferent in the decision whether to accept or reject the project. This project adds no monetary value. Decision should be based on other criteria (e.g., strategic positioning or other factors not explicitly included in the calculation). |
| Periods (years) | 6% | 8% | 10% | 12% | 14% |
|---|---|---|---|---|---|
| 1 | 0.943 | 0.926 | 0.909 | 0.893 | 0.877 |
| 2 | 0.890 | 0.857 | 0.826 | 0.797 | 0.769 |
| 3 | 0.840 | 0.794 | 0.751 | 0.712 | 0.675 |
| 4 | 0.792 | 0.735 | 0.683 | 0.636 | 0.592 |
| 5 | 0.747 | 0.681 | 0.621 | 0.567 | 0.519 |
| 6 | 0.705 | 0.630 | 0.564 | 0.507 | 0.456 |
| 7 | 0.665 | 0.583 | 0.513 | 0.452 | 0.400 |
| 8 | 0.627 | 0.540 | 0.467 | 0.404 | 0.351 |
| 9 | 0.592 | 0.500 | 0.424 | 0.361 | 0.308 |
| 10 | 0.558 | 0.463 | 0.386 | 0.322 | 0.270 |
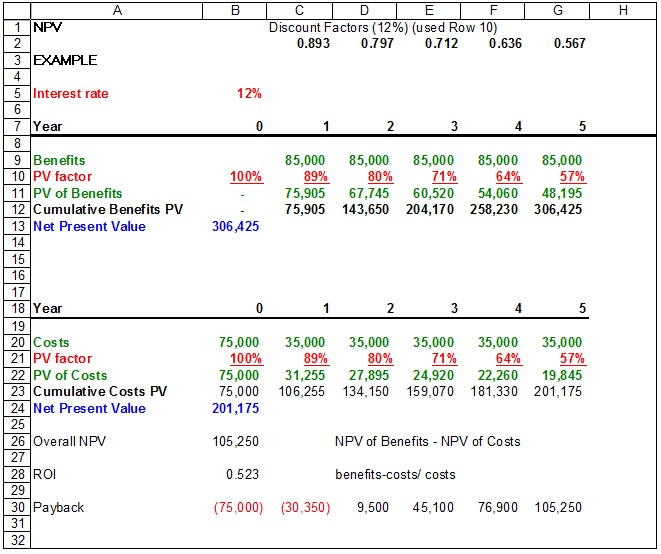
NPV Example
The following example is calculating the NPV of a project at a discount rate of 12%. The project takes five years to complete with given benefits and costs for each year. In Year 0, there is no benefit to the organization, just an initial cost of $75,000 with no discount rate. In Year 1, the discount rate is 89%. This means that at 12% assumed interest, the time value of money says that the $1 today is worth $0.89 in one year, $0.80 in two years, etc. By calculating the NPV for the benefits and the costs, you subtract the NPV of all costs from the NPV of all benefits. The final result is a positive value of $105,175.
Return On Investment (ROI)
Return on investment (ROI) is a performance measure used to evaluate the efficiency of an investment or to compare the efficiency of a number of different investments. It is one way of considering profits in relation to capital invested.
This is calculated by subtracting the project’s costs from the benefits and then dividing by the costs. For example, if you invest $100 and your investment is worth $110 next year, the ROI is (110 − 100) ÷ 100 = 0.1 or a 10% return.
In our example: (306,425 − 201,175) ÷ 201,175 = 0.52, or a 52% return. That’s considered a nice return on investment.
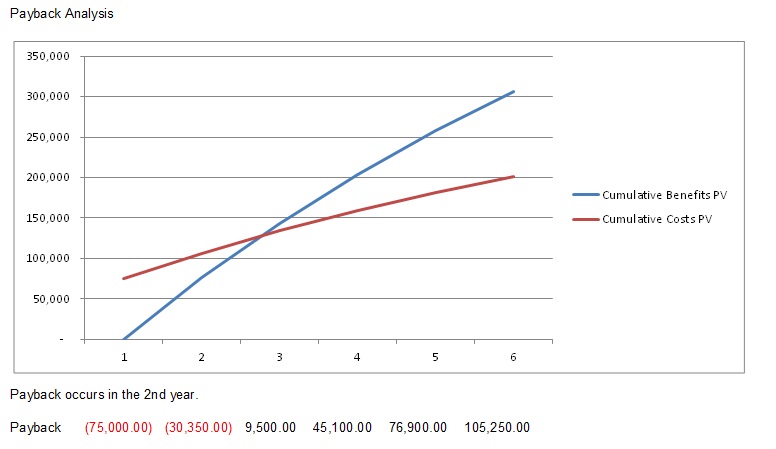
Payback Analysis
Payback analysis is important in determining the amount of time it will take for a project to recoup its investments. This is the point at which the benefits start to outweigh the costs. The best way to see that is by charting the cumulative benefits and costs. As you can see in the example in Figure 7.5, the cumulative benefits outweigh the cumulative costs in the second year.
Text Attributions
This chapter of Project Management is a derivative of the following works:
- Project Management by Merrie Barron and Andrew Barron. © CC BY (Attribution).
- Decision Matrix Method, Project Charter, and Net Present Value by Wikipedia. © CC BY-SA (Attribution-ShareAlike).
Media Attributions
- Project Management by Andreas Cappell © CC BY-NC-SA (Attribution NonCommercial ShareAlike)
- Figure 7.2 by Cord Rodefeld (top), ph-stop (middle), Evoflash (bottom) © CC BY-SA (Attribution ShareAlike)
- Unclear Objective Comic by Barron & Barron Project Management for Scientists and Engineers © CC BY (Attribution)
- Weighted Decision Matrix for Game Delivery by Adrienne Watt © CC BY (Attribution)
- NPV Example by Adrienne Watt © CC BY (Attribution)
- Payback Analysis Chart by Adrienne Watt © CC BY (Attribution)
