
44 Network Diagram & Critical Path
Creating the Network Diagram
Many project managers use network diagrams when scheduling a project. The network diagram is a way to visualize the interrelationships of project activities. Network diagrams provide a graphical view of the tasks and how they relate to one another. The tasks in the network are the work packages of the WBS. All of the WBS tasks must be included in the network because they have to be accounted for in the schedule. Leaving even one task out of the network could change the overall schedule duration, estimated costs, and resource allocation commitments.
The first step is to arrange the tasks from your WBS into a sequence. Some tasks can be accomplished at any time throughout the project where other tasks depend on input from another task or are constrained by time or resources.
The WBS is not a schedule, but it is the basis for it. The network diagram is a schedule but is used primarily to identify key scheduling information that ultimately goes into user-friendly schedule formats, such as milestone and Gantt charts.
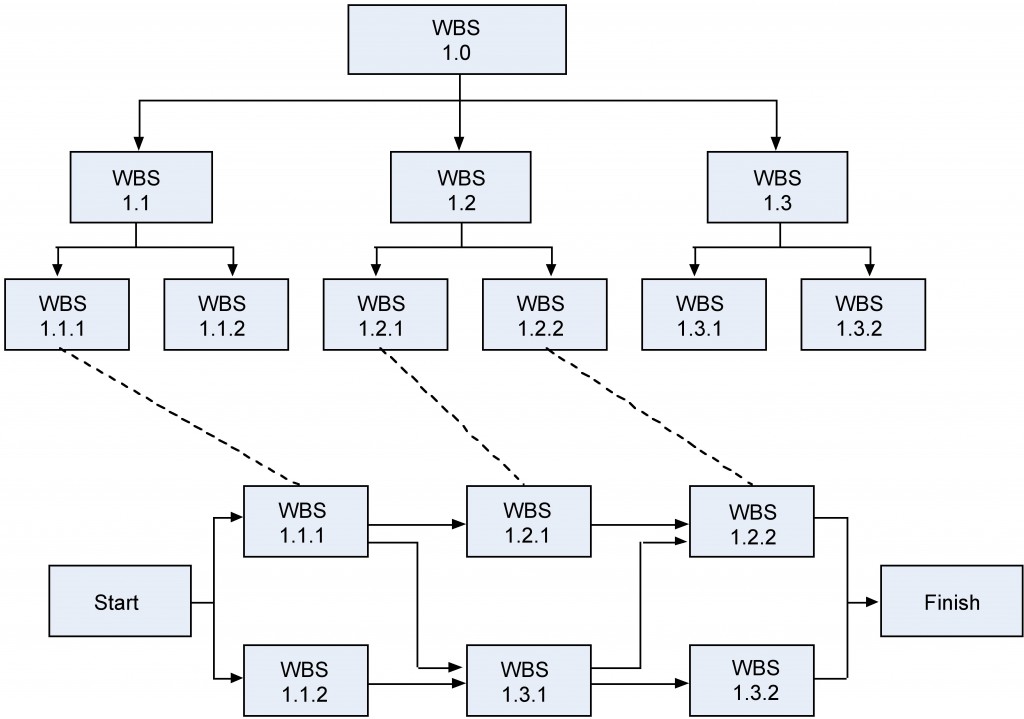
The network diagram provides important information to the project team. It provides information about how the tasks are related (Figure 10.9), where the risk points are in the schedule, how long it will take as currently planned to finish the project, and when each task needs to begin and end.
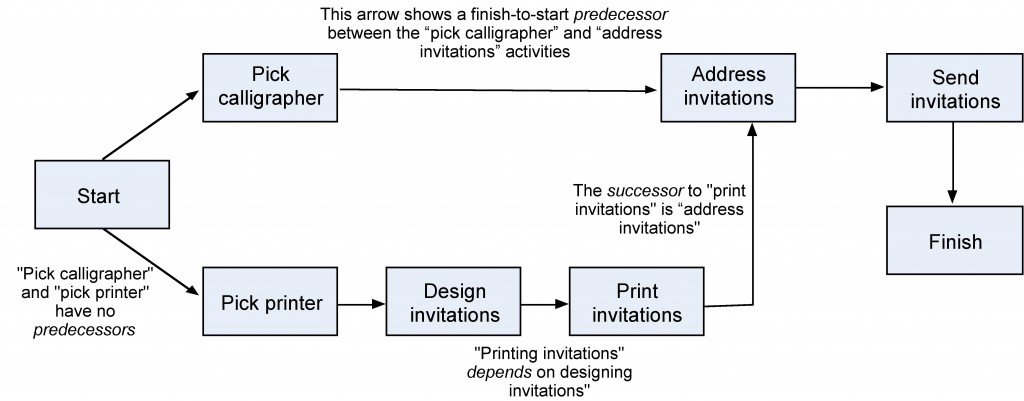
In our wedding planner example, Sally would look for relationships between tasks and determine what can be done in parallel and what activities need to wait for others to complete. As an example, Figure 10.10 shows how the activities involved in producing the invitations depend on one another. Showing the activities in rectangles and their relationships as arrows is called a precedence diagramming method (PDM). This kind of diagram is also called an activity-on-node (AON) diagram.
Another way to show how tasks relate is with the activity-on-arrow (AOA) diagram. Although AON is more commonly used and is supported by all project management programs, PERT is the best-known AOA-type diagram and is the historical basis of all network diagramming. The main difference is the AOA diagram is traditionally drawn using circles as the nodes, with nodes representing the beginning and ending points of the arrows or tasks. In the AOA network, the arrows represent the activities or tasks (Figure 10.11).
All network diagrams have the advantages of showing task interdependencies, start and end times, and the critical path (the longest path through the network) but the AOA network diagram has some disadvantages that limit the use of the method.
The three major disadvantages of the AOA method are:
- The AOA network can only show finish-to-start relationships. It is not possible to show lead and lag except by adding or subtracting time, which makes project tracking difficult.
- There are instances when dummy activities can occur in an AOA network. Dummy activities are activities that show the dependency of one task on other tasks but for other than technical reasons. For example, one task may depend on another because it would be more cost effective to use the same resources for the two; otherwise the two tasks could be accomplished in parallel. Dummy activities do not have durations associated with them. They simply show that a task has some kind of dependence on another task.
- AOA diagrams are not as widely used as AON diagrams simply because the latter are somewhat simpler to use, and all project management software programs can accommodate AON networks, whereas not all can accommodate AOA networks.
The Critical Path
The critical path describes the sequence of tasks that would enable the project to be completed in the shortest possible time. It is based on the idea that some tasks must be completed before others can begin. A critical path diagram is a useful tool for scheduling dependencies and controlling a project. In order to identify the critical path, the length of time that each task will take must be calculated.
Let’s take a look at an example. The length of time in weeks for each key stage is estimated:
| Key stage | Estimated time in weeks |
|---|---|
| A. Secure funds | 0 |
| B. Negotiate with other agencies | 4 |
| C. Form advisory group | 4 |
| D. Establish data collection plan | 6 |
| E. Collect data | 4 |
| F. Write directory text | 4 |
| G. Identify printer | 2 |
| H. Agree print contract | 2 |
| I. Print directory | 4 |
| J. Agree distribution plan | 12 |
| K. Organize distribution | 4 |
| L. Distribute directory | 2 |
We have given the key stage “Secure funds” an estimated time of zero weeks because the project cannot start without the availability of some funding, although estimates would provide detail at a later stage. The stages can now be lined up to produce a network diagram that shows that there are three paths from start to finish and that the lines making up each path have a minimum duration (Figure 10.12).
If we now trace each of the possible paths to “Distribute directory” (the finishing point), taking dependencies into account, the route that has the longest duration is known as the critical path. This is the minimum time in which it will be possible to complete the project.
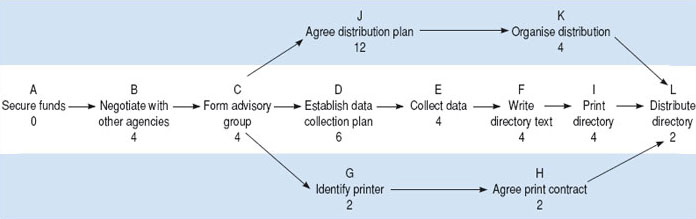
In this example, the critical path is A–B–C–D–E–F–I–L, and the earliest completion date for the project is the sum of the estimated times for all the stages on the critical path – 28 weeks – from the point of securing the funding. All the key stages on the critical path must be completed on time if the project is to be finished on schedule.
If the projected total time is much longer than the project sponsor’s expectations, you will need to renegotiate the time scale. Mapping the critical path helps to identify the activities that need to be monitored most closely.
Milestones
One way to avoid getting lost in a sea of details is to focus on your project’s milestones, which can serve as a high-level guide. You can use pull planning to identify your project’s milestones, and then use the critical path to figure out how to hit those milestones. It gives a reality test to whether your milestones are in fact achievable. Then you’re off and running, in living order.
In an excellent blog post on the usefulness of milestones, Elizabeth Harrin (2017) explains that milestones should be used “as a way of showing forward movement and progress and also show people what is going on, even if they don’t have a detailed knowledge of the tasks involved to get there. In that respect, they are very useful for stakeholder communication and setting expectations” (Harrin, 2017). You can use milestones, she explains, to track your progress, focus on:
- starting of significant phases of work
- ending of significant phases of work
- marking the deadline for something
- showing when an important decision is being made. (Harrin, 2017)
Milestones are especially useful as a form of communication on the health of a project. A version of a project schedule that consists only of milestones allows stakeholders to get a quick sense of where things stand. You may want to report on milestones in the project’s dashboard, which should serve as an at-a-glance update for the project.
Resource Planning
This chapter of Project Management is a derivative of the following texts:
- Project Management by Merrie Barron and Andrew Barron. © CC BY (Attribution).
- Planning a Project by OpenLearn Labspace. © CC BY-NC-SA (Attribution-NonCommercial-ShareAlike).
- Essentials of Project Management by Adam Farag is licensed under a Creative Commons Attribution-NonCommercial-ShareAlike 4.0 International License, except where otherwise noted.Media Attributions
- WBS and Network Diagram by Barron & Barron Project Management for Scientists and Engineers © CC BY (Attribution)
- AON Diagram by Barron & Barron Project Management for Scientists and Engineers © CC BY (Attribution)
- Activity arrow diagram by Barron & Barron Project Management for Scientists and Engineers © CC BY (Attribution)
- Critical Path Diagram by Open University © CC BY-NC-SA (Attribution NonCommercial ShareAlike)
